Method: Reading Derivatives Off Graphs
Step 1: Identify and then boldly label the graph you are working with.
I know you think you can keep track of which graph you are looking at, but I am here to tell you that your test brain does not function like your normal brain. Once you know what graph you are looking label that graph in big bold letters.
Step 2: Determine if you are being asked to go move down a level or move up a level.
Basically, are you being asked to find the derivative of the graph you are given (move down a level), or are you being asked to use the given graph to talk about the behavior of a previous graph (move up ).
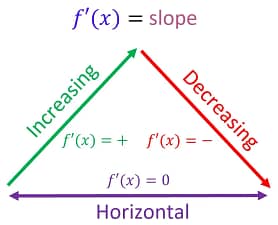
Step 3 (If you are moving down ): Mark your given graph with plus (+), minus (-), and zero (0) based on the 1 st Derivative Triangle.
If you are moving down a level, then you are being asked to find a derivative. No matter if you are given an and asked to find the , or if you are given the and asked to find the , both situations are just asking you to find the1 st Derivative of your given graph. The meaning of the resulting graph will be different, but the process is the same.
Step 3 (If you are moving up ): Layout a number line with the plus (+), minus (-), and zero (0) based on the y-values of the given graph.
This is another example of trying to help your test brain out. As you are reading the data off your graph, you really want to stop yourself from looking at the given graph as an graph. No matter how many times you do it, your brain will always try reading any given graph like you have read every other graph in your math life. To keep yourself from doing that, you want to pull the important data off the graph, and label it on a number line.
Always start by marking the zeros on your number line, and then mark plusses and minuses in all the intervals created by your zeroes. As you do this, I find it helpful to draw and arrow that matches the behavior of the interval based on the derivative triangle.
Step 4 (If you are moving down ): Use your plus (+), minus (-), and zero (0) that you marked along with their estimated slope to determine the y-values on the graph you are moving down to.
The first points that you will always want to graph will be the zeros that you have marked. You know where a zero value will always be graphed, it will always be graphed on the x-axis . After that you want to work your way left to right keeping in mind that the steeper the graph the larger the number, and increasing means a positive slope, and decreasing means a negative slope. I find it helpful to use approximated values to keep track of it all. A steep positive slope I would use m=15 , or a flat negative slope I use m=-1 in my head or writing on the actual graph. If you are given a piecewise graph with constants and linear equations , you can actually use real values if needed. The derivative of a constant is always zero, and the derivative of a linear equation ( y= m x+b ) is always the m , the slope.
Step 4 (If you are moving up ): Use your number line to interpret the graph’s data.
Based on the number line you created you can sketch the curve that came before it, and also determine where that previous curve was increasing or decreasing. When sketching the curve, you want to start by marking the location of your critical values or inflection points first. You may not know the specific point, , they are located at, which is fine, but you do want to give yourself a point to reference as you do your sketch. Since these points are where the graph’s behavior has the potential for change, we want to make sure we know how the graph looks on either side. Always make sure that your new graph passes the vertical line test to ensure it is actually a function.