Example 1: Curve Sketching
This example is using the same that was used in Example 1 of the 1 st Derivative Test section and in the 2 nd Derivative Test section. I will not go into great detail on the algebra mechanics here. If you would like more details on the algebra moves, please review the previous examples.
|
Sketch a graph of using the 1 st and 2 nd Derivatives.
|
|||||
|
Step 1: Find the first and second derivatives, and . You will need both derivatives, so you might as well just find both derivatives at the same time since your head is in that type of space. |
|
||||
|
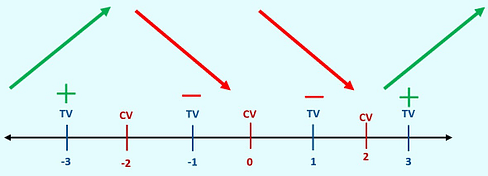
Step 2: Run the First 3-Steps of the 1 st Derivative Test for Intervals of Increasing and Decreasing. 1) Find 2) Find Critical Values . OR 3) Do the 1 st Derivative Test (Number Line Game) |
1) 2)
3)
|
||||
|
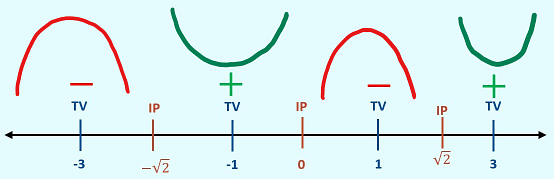
Step 3: Run the First 3-Steps of the 2 nd Derivative Test for Intervals of Concave Up and Concave Down. 1) Find 2) Find the possible inflection points of the equation. or 3) Do the 2 nd Derivative Test (Number Line Game) |
1) 2)
3)
|
||||
|
Step 4: Create a combined number line bringing together the data from your 1 st Derivative Test number line and your 2 nd Derivative Test number line. 1) Start by marking all your critical values and inflection points on the number line. 2) Then draw dotted lines down from each of the critical values and inflection points. 3) Label on the left-hand side of the number line starting at the top with , then below that , and then finally below that . 4) Finally bring your + and – from your 1 st Derivative and 2 nd Derivative number lines, and label each of the intervals that were created by your dotted lines.
|
1)
|
||||
|
2)
|
|||||
|
3)
|
|||||
|
4)
|
|||||
|
Step 5: Read the shape of the curve based upon your combined number line, and draw it in the section of your chart. There are two sides to each concavity shape , an increasing side and a decreasing side. Use the 1 st Derivative, , data to determine if the graph is + = increasing or – = decreasing, and then use the 2 nd Derivative, , data to know if it is + = concave up or – = concave down.
|
|
||||
|
Step 6: Sketch the curve on your graph taking the shapes you drew on your number line, and connecting them at the critical points and inflection points .
Often times you will need to plug the x-values of your critical values and inflection points back into the original equation, , to get the y-values that go with those x-values .
The critical points and inflection points are where your graph is changing behavior. Literally you are being asked to connect the dots. Elementary school skills for the win.
|
i) Critical Value:
|
Critical Value:
|
Critical Value Inflection Point:
|
Inflection Point:
|
Inflection Point:
|
|
ii)
|
|||||
|
iii)
|
|||||
|
Final Result: This would be the sketch of using the 1 st Derivative and 2 nd Derivatives.
Remember: Always make sure that your sketch passes the vertical line test , that it is a function. |
|||||