Example 3: Reading Local Extrema and Intervals of Increasing and Decreasing from f′(x).
|
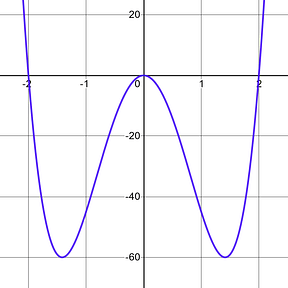
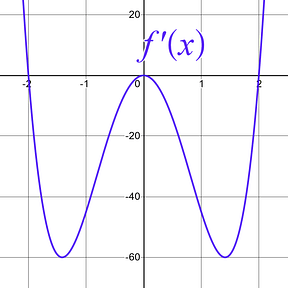
Sketch the graph of , based on the given graph. Also, determine the intervals where is increasing and decreasing, and the locations of any relative extrema.
|
|||
|
Step 1: Identify and then boldly label the graph you are working with. In this example you have been given the derivative graph, the graph.
|
|
||
|
Step 2: Determine if you are being asked to go move down a level or move up a level. |
In this example you are being asked to determine data about the original , given the . This tells you that we will need to move up from your given graph. |
||
|
Step 3 (If you are moving up ): Layout a number line with the plus (+), minus (-), and zero (0) based on the y-values of the given graph.
Start by marking the zeros on your number line, and then mark plusses (above the x-axis )and minuses (below the x-axis ) in all the intervals created by your zeroes.
As you do this, I find it helpful to draw and arrow that matches the behavior of the interval based on the derivative triangle.
|
Start by marking the zeroes on the number line. These are your critical values.
|
Then mark on the number line the plusses (above the x-axis )and minuses (below the x-axis ) in all the intervals created by your zeroes.
|
|
|
Step 4 (If you are moving up ): Use your number line to interpret the graph’s data. Based on the number line you created you can sketch the curve that came before it, and also determine where that previous curve was increasing or decreasing.
When sketching the curve, you want to start by marking the location of your critical values or inflection points first. You may not know the specific point, , they are located at, which is fine, but you do want to give yourself a point to reference as you do your sketch. These points are where the graph’s behavior has the potential for change, and we know that there needs to be a horizontal tangent line. Always make sure that your new graph passes the vertical line test to ensure it is actually a function. |
|
|
|
|
Final Result: The sketch of the graph would look just like what you drew in Step 4 .
Intervals of Increasing and Decreasing : You really only need the number line data to determine the answers to these questions, but you can also use the graph you sketched if you find that method easier. Where the 1st Derivativegraph has positive y-values , the original graph, , is increasing. Intervals where you put a plus symbol on your number line are the increasing intervals. Increasing : The x-interval would be . Notice that you would not include the end points because infinity has not actual value and at critical values , the graph is not increasing or decreasing . We use the union symbol to connect the two x-intervals .
Where the 1st Derivativegraph has negative y-values , the original graph, , is decreasing. Intervals where you put a minus symbol on your number line are decreasing intervals. Decreasing : The x-interval would be . This answer might shock you, and possibly your instructor. Keep in mind that asking you if a function is decreasing is ever so slightly different than asking you if the derivative is negative. Decreasing strictly means that y-values to just to the left of the y-values next to them are always larger . Even though the graph goes horizontal for a moment at x=0 , that does not stop the decreasing behavior. The y-value at x=0 is larger than the y-value just to the right of it, which means the function is still decreasing at x=0 . Negative Derivative : The x-interval would be . Notice that you would not include the end points because at critical values , the graph is horizontal ( zero slope ). We use the union symbol to connect the two x-intervals .
Relative Extrema: Again, you can read this information straight from your number line, and don’t actually need the graph itself. Local Max: When you look for a relative maximum, you want to see the shape of a max
Local Min: When you look for a relative minimum, we want to see the shape of a min
Here is your number line
First at x=-2 you have a Local Max because the graph switches from positive to negative. At x=0 there is neither a max or a min. Just because you have a critical value, that does not mean that you have a max or a min only that the graph went horizontal there for a moment. At x=2 you have a Local Min because the graph switches from negative to positive. |
|||