Method: Curve Sketching
Step 1: Find and .
Step 2: Run the First 3-Steps of the 1 st Derivative Test for Intervals of Increasing and Decreasing.
Step 3: Run the First 3-Steps of the 2 nd Derivative Test for Intervals of Concave Up and Concave Down.
Step 4: Create a combined number line bringing together the data from your 1 st Derivative Test number line and your 2 nd Derivative Test number line.
- Start by marking all your critical values and inflection points on the number line.
- Then draw dotted lines down from each of the critical values and inflection points.
- Label on the left-hand side of the number line starting at the top with , then below that , and then finally below that .
- Finally bring your + and – from your 1 st Derivative and 2 nd Derivative number lines, and label each of the intervals that were created by your dotted lines.
Step 5: Read the shape of the curve based upon your combined number line, and draw it in the section of your chart.
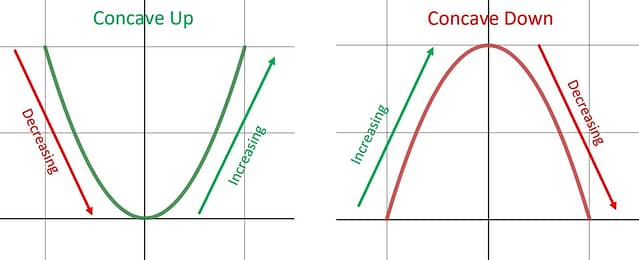
There are two sides to each concavity shape , an increasing side and a decreasing side. Use the 1 st Derivative, , data to determine if the graph is + = increasing or – = decreasing, and then use the 2 nd Derivative, , data to know if it is + = concave up or – = concave down.
Step 6: Sketch the curve on your graph taking the shapes you drew on your number line, and connecting them at the critical points and inflection points .
- If you were given any specific points, ( x ,y), that had to be on your graph other than the critical points and the inflection points .
- Mark your critical points and inflection points on your graph.
Often times you will need to plug the x-values of your critical values and inflection points back into the original equation, , to get the y-values that go with those x-values .
- Use your combined number line shapes to connect those dots.
The critical points and inflection points are where your graph is changing behavior.