Example 3: In Terms of y (No Calculator Allowed)
|
Find the area of the region enclosed by the curves and . |
|||
|
Step 1: Determine whether your equation is in terms of x (standard: ) or in terms of y (non-standard: ).
In this example both of the equations are in terms of y .
As you are not allowed to use a calculator on this problem, you are expected to have a general idea of what these two curves look like.
The big difference here is that your equations are in terms of y . This means that you treat the y-axis as the independent variable (what you plug in), and the x-axis is now the dependent variable (what you get out).
Don’t over think this though. The same families of graphs work when you are in terms of y . It really is just about a rotating of the graphs 90 ◦ to help you visualize a little better.
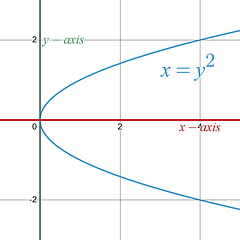
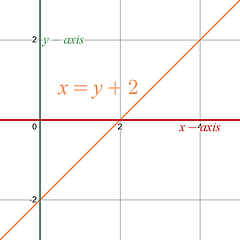
is and even power of x , which means it comes from the parabola family. is a linear equation. |
|
||
|
Normal Position
|
Normal Position
|
||
|
Rotated Left 90 ◦
|
Rotated Left 90 ◦
|
||
|
Step 2: Determine the bounds of the integral, , for each of your enclosed regions.
Since you are only given the equations to work with, and are not allowed to use a calculator, you will need to set the two equations equal to each other, and then solve for y (i.e., get y alone on one side of the equals).
In these situations, the most common method will be to get the equation set equal to zero, and then factor the equation. Once you have factored the equation you set each of your factors equal to zero , and solve those smaller math problems for y to find your final results.
As you are looking for the region bounded by these equations, you are looking at the y-interval in between the y-values you found as solutions. The smaller of the y-values will be your lower bound, a , and the larger of the y-values will be the upper bound, b .
Here the smaller value is , and the larger value is |
|
||
|
|
|
||
|
|
|||
|
Step 3: Determine the Top and Bottom equations for all of your enclosed regions.
If you know what these graphs look like, then you probably know which equation should be considered the Top equation and the Bottom equation.
If you don’t know what these graphs look like, then you will need to apply a plug and chug method to determine which equation has the larger x-value in your bounded region.
Thinking about the bounds you found in Step 2 in terms of a number line, you want to choose a y-value in between the two bounds. Here choosing y = 0 would be a good option. First because it is in the region you care about, and second because it is a number that is easy to perform your calculations with.
Plugging y = 0 into your two equations, , you find that is the Top equation because it has the larger x-value .
Top : Bottom : |
|
||
|
Test for Comparing x-values
Smaller x-value = Bottom |
Test for Comparing x-values
Larger x-value = Top |
||
|
Normal Position
|
Rotated Left 90 ◦
|
||
|
Step 4: Setup a Definite Integral problem for each of your enclosed regions using your Area Between Two Curves formula
|
|
||
|
Final Result: The area of the region enclosed by the curves and is . |
|||
|
Normal Position
|
Rotated Left 90 ◦
|
||