Example 1: Trapezoidal Riemann Sums
|
Use 6 subintervals and trapezoids to estimate the area between the curve and the x-axis for on the interval . |
|
|
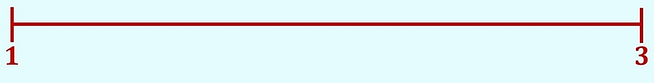
Step 1: Draw a number line with the left and right endpoints of the number line coming from your given interval, [ a , b ]= [1,3].
|
|
|
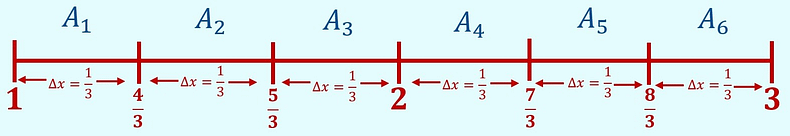
Step 2: Calculate your , the height from your formula:
The number of intervals would be 6 since the problem asks us to use 6 subintervals. |
|
|
Step 3: Mark your subintervals on your number line.
Here you have . Starting at the left endpoint and ending at the right endpoint.
Label these gaps between each mark . |
|
|
Step 4: Start laying out your area formulas for each of your subintervals. |
|
|
Step 5: Choose your two evaluation points, , for each of your subintervals, and plug those values into your equations form Step 4. The evaluation points for the trapezoid method will always be the left and right endpoints of each subinterval.
|
|
|
Step 6:
Get your actual area value for each of your different area formulas by plugging your evaluation points, , into the actual equation, , to find your
base 1
and
base 2
values, then multiply those values by your , your
height
, and finally multiply that by to find the areas,
We use the same as the height for each area formula, and we also use the same equation, , to find the both base 1 and base 2 . |
|
|
Step 7: Add up the areas of all of your subinterval trapezoids to get an estimate for the total area between the curve and the x-axis .
|
|
|
Step 8 (only if asked): Draw the trapezoids that you just found the areas of. Start on the x-axis at the evaluation point , , that you found in Step 5. Draw up from that point until you hit your actual graph, , then draw a line connecting that point with the other side of the trapezoid , your , that covers that trapezoid’s subinterval, and then draw back down to the x-axis . Repeat the process for each of your subintervals. I always say, “Draw up. Draw over. Draw down.”
|
|