Riemann Sums Using Rectangles
Riemann Sums have you estimate the area between a curve and the x-axis using the areas of standard geometric shapes. The most common shape used to estimate the area is a rectangle. You will be using the areas of rectangles to estimate the area between a curve and the x-axis . Here is how you go from the area of a rectangle formula you know, and turn it into the formula you will use for Riemann Sums.
|
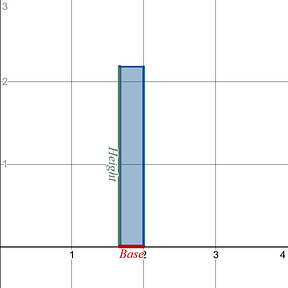
You start with your standard area of a rectangle formula. |
|
|
||
|
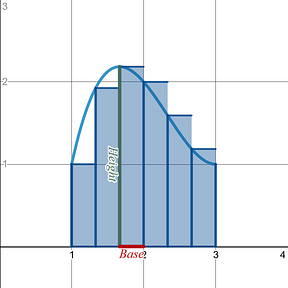
You then take that standard area of a rectangle formula and apply it to an actual curve, . The base of your rectangle is the distance between x-values , which is called , or the change in x . The height of your rectangles will be the y-values you get by plugging in a specific x-value . The notation for that looks like . Where the input, , is what changes the height of each rectangle. Those inputs , x-values , will be the key to determining the height of each of your rectangles . |
|
|
||
|
You will be given directions on: i) How to break your overall x-interval , [ a , b ], into the smaller subintervals , , that you will use as the . The is often the same value from rectangle to rectangle, but you will see AP Calc Exam questions that only provide you a table of values , and that table of values may not have a consistent . Be careful when using a table.
|
||||
|
ii) How to select the evaluation point, , you will use to find your . The five most common methods for selecting the evaluation point are the Left Hand Sum, Right Hand Sum, Midpoint Sum, Upper Sum, and Lower Sum. |
||||
|
Left Hand Sum |
Right Hand Sum |
Midpoint Sum |
Upper Sum |
Lower Sum |
|
The evaluation points, , are the left hand endpoint of your subintervals . |
The evaluation points, , are the right hand endpoints of your subintervals . |
The evaluation points, , are the midpoint of your subintervals .
|
The upper sum requires you to make the decision for the evaluation point, . You must choose either the left or right endpoint of the x-subinterval as your based on which one gives the largest y-value . |
The lower sum requires you to make the decision for the evaluation point, . You must choose either the left or right endpoint of the x-subinterval as your based on which one gives the smallest y-value . |
|
|
|
|
|
|
|
The Summation Portion: Once you have calculated the area of the rectangle for each of your subintervals, you then add up all those areas to get the net area between a curve and the x-axis . Net area means you treat area above the x-axis as positive and area below the x-axis as negative, and then add them all up. A positive net area does not tell you that all the area is above the x-axis only that there is more area above the x-axis than area below the x-axis . A negative net area does not tell you that all the area is below the x-axis only that there is more area below the x-axis than area above the x-axis . A zero net area does not tell you that there is no area between the curve and the x-axis , only that there is equal amounts of area above and below the x-axis . |
||||
|
Meaning: In terms of an actual application (word) problem your result will be the net total amount of whatever the units on the top part of your rate. In terms of , it would be the net total of the units. If the rate’s unit is , the result would be the net total meters traveled from the starting point (displacement) on the x-interval you were given, [ a , b ]. If your rate’s unit is talking fish per day, , then the result would be the net total fish accumulated during the x-interval you were given, [ a , b ]. |
||||